Tracing Historical Weather Impacts on Horse Racing Outcomes Across Global Circuits
Paul Hansen · Aug 20, 2026
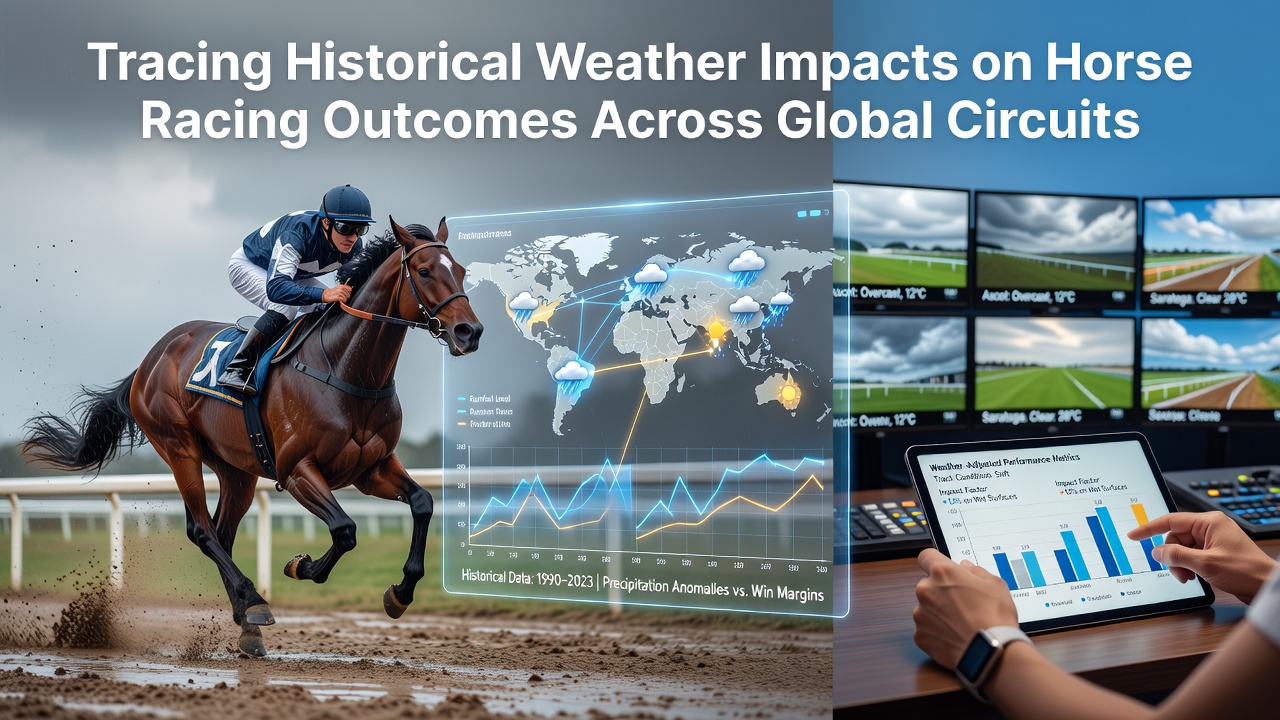
Tracing Historical Weather Impacts on Horse Racing Outcomes Across Global Circuits
Weather patterns have shaped horse racing results for centuries, with track surfaces, horse stamina, and race timing all responding directly to shifts in temperature, precipitation, and wind across circuits in North America, Europe, Asia, and Australia. Records from the 19th century onward show that rain-softened ground consistently slowed times in events like the Melbourne Cup, while dry spells produced firmer surfaces that favored speed-oriented runners in the Kentucky Derby.
Early Documentation of Weather Effects
Archival race reports from the 1800s detail how sudden downpours turned British turf circuits into heavy going that rewarded stayers over sprinters, and similar patterns appear in American records where summer heat waves raised equine core temperatures and altered pace strategies. Observers note that these conditions forced trainers to adjust shoeing and conditioning routines well before race day, a practice that persists in modern programs. Data from long-term meteorological logs paired with official result sheets reveal measurable correlations between rainfall totals and finishing margins, particularly in races exceeding 2000 meters where cumulative fatigue compounds surface resistance.
Regional Variations Across Major Circuits
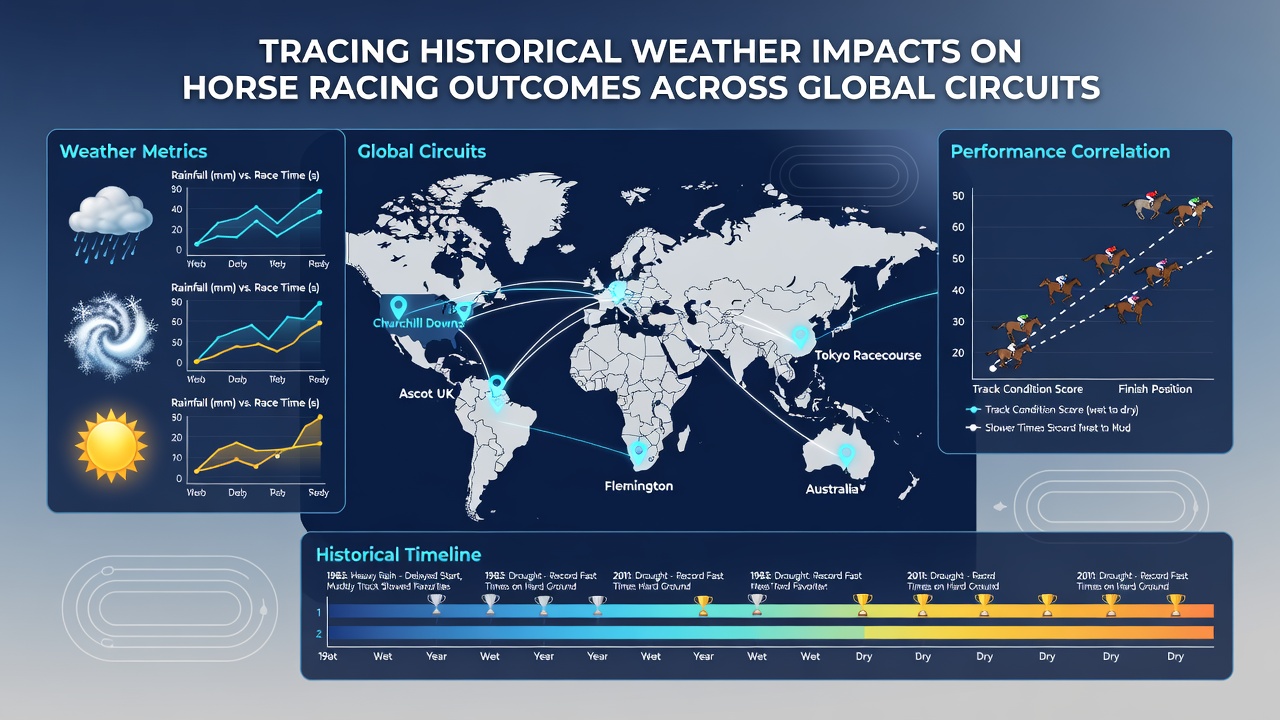
In Australia, records maintained by racing authorities demonstrate that drought periods preceding the spring carnival often produced lightning-fast tracks at Flemington and Randwick, leading to record-breaking performances in the 1980s and 1990s. Conversely, the wettest Melbourne Cup on record occurred in 1976 when persistent rain left the course rated heavy, and the winner posted a time nearly eight seconds slower than the previous decade’s average. Across the Pacific, Japanese tracks in the Kansai region have shown comparable sensitivity, with typhoon remnants creating deep going that historically benefited horses bred for wet conditions from northern studs.
North American circuits display their own signatures. Saratoga’s clay-based surfaces compact differently under prolonged dry spells than under intermittent showers, and researchers tracking Belmont Stakes results since 1900 found that temperatures above 30 degrees Celsius correlated with slower final quarters in the majority of editions. In contrast, the same dataset indicates that moderate wind from the southwest frequently aided closers by reducing effective headwinds on the backstretch.
Quantitative Studies and Data Integration
Analyses combining official weather station readings with race timing databases have produced clearer patterns. A multi-decade project drawing on Australian Bureau of Meteorology archives and Racing Australia result files established that every additional 10 millimeters of rainfall in the 48 hours before post time increased average winning times by approximately 1.2 percent on turf, with the effect more pronounced on courses lacking advanced drainage systems. Similar work conducted on Hong Kong tracks, where the Jockey Club maintains detailed environmental logs, showed that humidity levels above 85 percent coincided with higher rates of late-race deceleration in sprints.
European circuits outside the United Kingdom have contributed additional evidence. French racing data compiled by France Galop and cross-referenced with Météo-France observations indicate that autumn races at Longchamp experience wider performance spreads when early frost precedes heavy rain, creating patchy ground that rewards tactical positioning over raw speed. In Scandinavia, trainers have long monitored soil temperature because frozen sub-layers beneath a thin thawed surface produce inconsistent footing that historically disadvantaged front-runners.
Technological Responses and Record Keeping
Modern measurement tools have refined these historical observations. Since the early 2000s, many circuits have installed automated track-moisture sensors that feed real-time data into official going reports, allowing direct comparison with past conditions. By August 2026, several major venues plan to integrate satellite-derived precipitation forecasts with historical outcome models to refine pre-race assessments, building on datasets already spanning more than a century. These advances sit alongside traditional methods such as the going stick used at Australian and New Zealand tracks, which provides a numerical reading still calibrated against decades of manual observations.
Conclusion
Longitudinal examination of weather and racing outcomes demonstrates consistent, quantifiable relationships that vary by region, surface type, and race distance. Continued integration of meteorological records with performance databases allows administrators and participants to anticipate how conditions may shift results, while preserving the empirical record that began wth handwritten stewards’ notes in the 19th century.